
We Showed Up| Planet, With People
Awards & Nominations
We Showed Up has received the following awards and nominations. Way to go!
Planet, With People
WeShowedApp
Summary
•Developed an interface to map attributes of human population using NASA data and local resources in keeping with the Human Planet Initiative to improve mapping potential areas of risk.•Case study chosen: flooding due to rainfall in Karachi, Pakistan in 2020.•Monitored and mapped factors onto a map that affect the risk of floods due to rainfall.•Used crowd-sourcing and volunteers to collect local data.•Made a "Risk Ratio" by combining other factors and integrated into map to identify risk-free zones.•Designed an app where people could report problems and help AI identify problems itself using captcha technique.•Made data easily understandable for public to create awareness.
How We Addressed This Challenge
- A website that integrates relevant data from NASA, JAXA, ESA, and other local resources including crowd-sourcing onto a single map as layers.
- The different colors on the map show different ranges of factors affecting the risk of floods due to rainfall such as that in Karachi, Pakistan in August 2020.
- Concerned authorities will be able to choose from the map to show the distribution of a certain factor throughout the vast city of Karachi.
- Factors integrated on the map include:
- Population density distributions obtained from SEDAC to locate areas of high population density, thus at a greater risk of the consequences of flood and in greater need of urgent action.
- Distribution of the total population by age groups obtained from SEDAC to identify which areas to prioritize to help the elderly and the children first in case of an emergency.
- Rainfall intensity data collected from the JAXA website to spot areas with greater precipitation and therefore, at a greater risk of flood.
- Infrastructure quality using Impervious Surface Percentage (GMIS) and Human Built-up and Settlement Extent (HBASE) to predict the drainage of rainwater in case of an unprecedented high rainfall.
- Presence of Mangrove forests to calculate the risk of flooding through the sea.
- Urban Extents to categorize places into urban and rural areas so actions can be modified accordingly.
- Elevation of different areas of the city to triangulate areas at a greater elevation which will allow less surface accumulation and more surface run-off of rainwater.
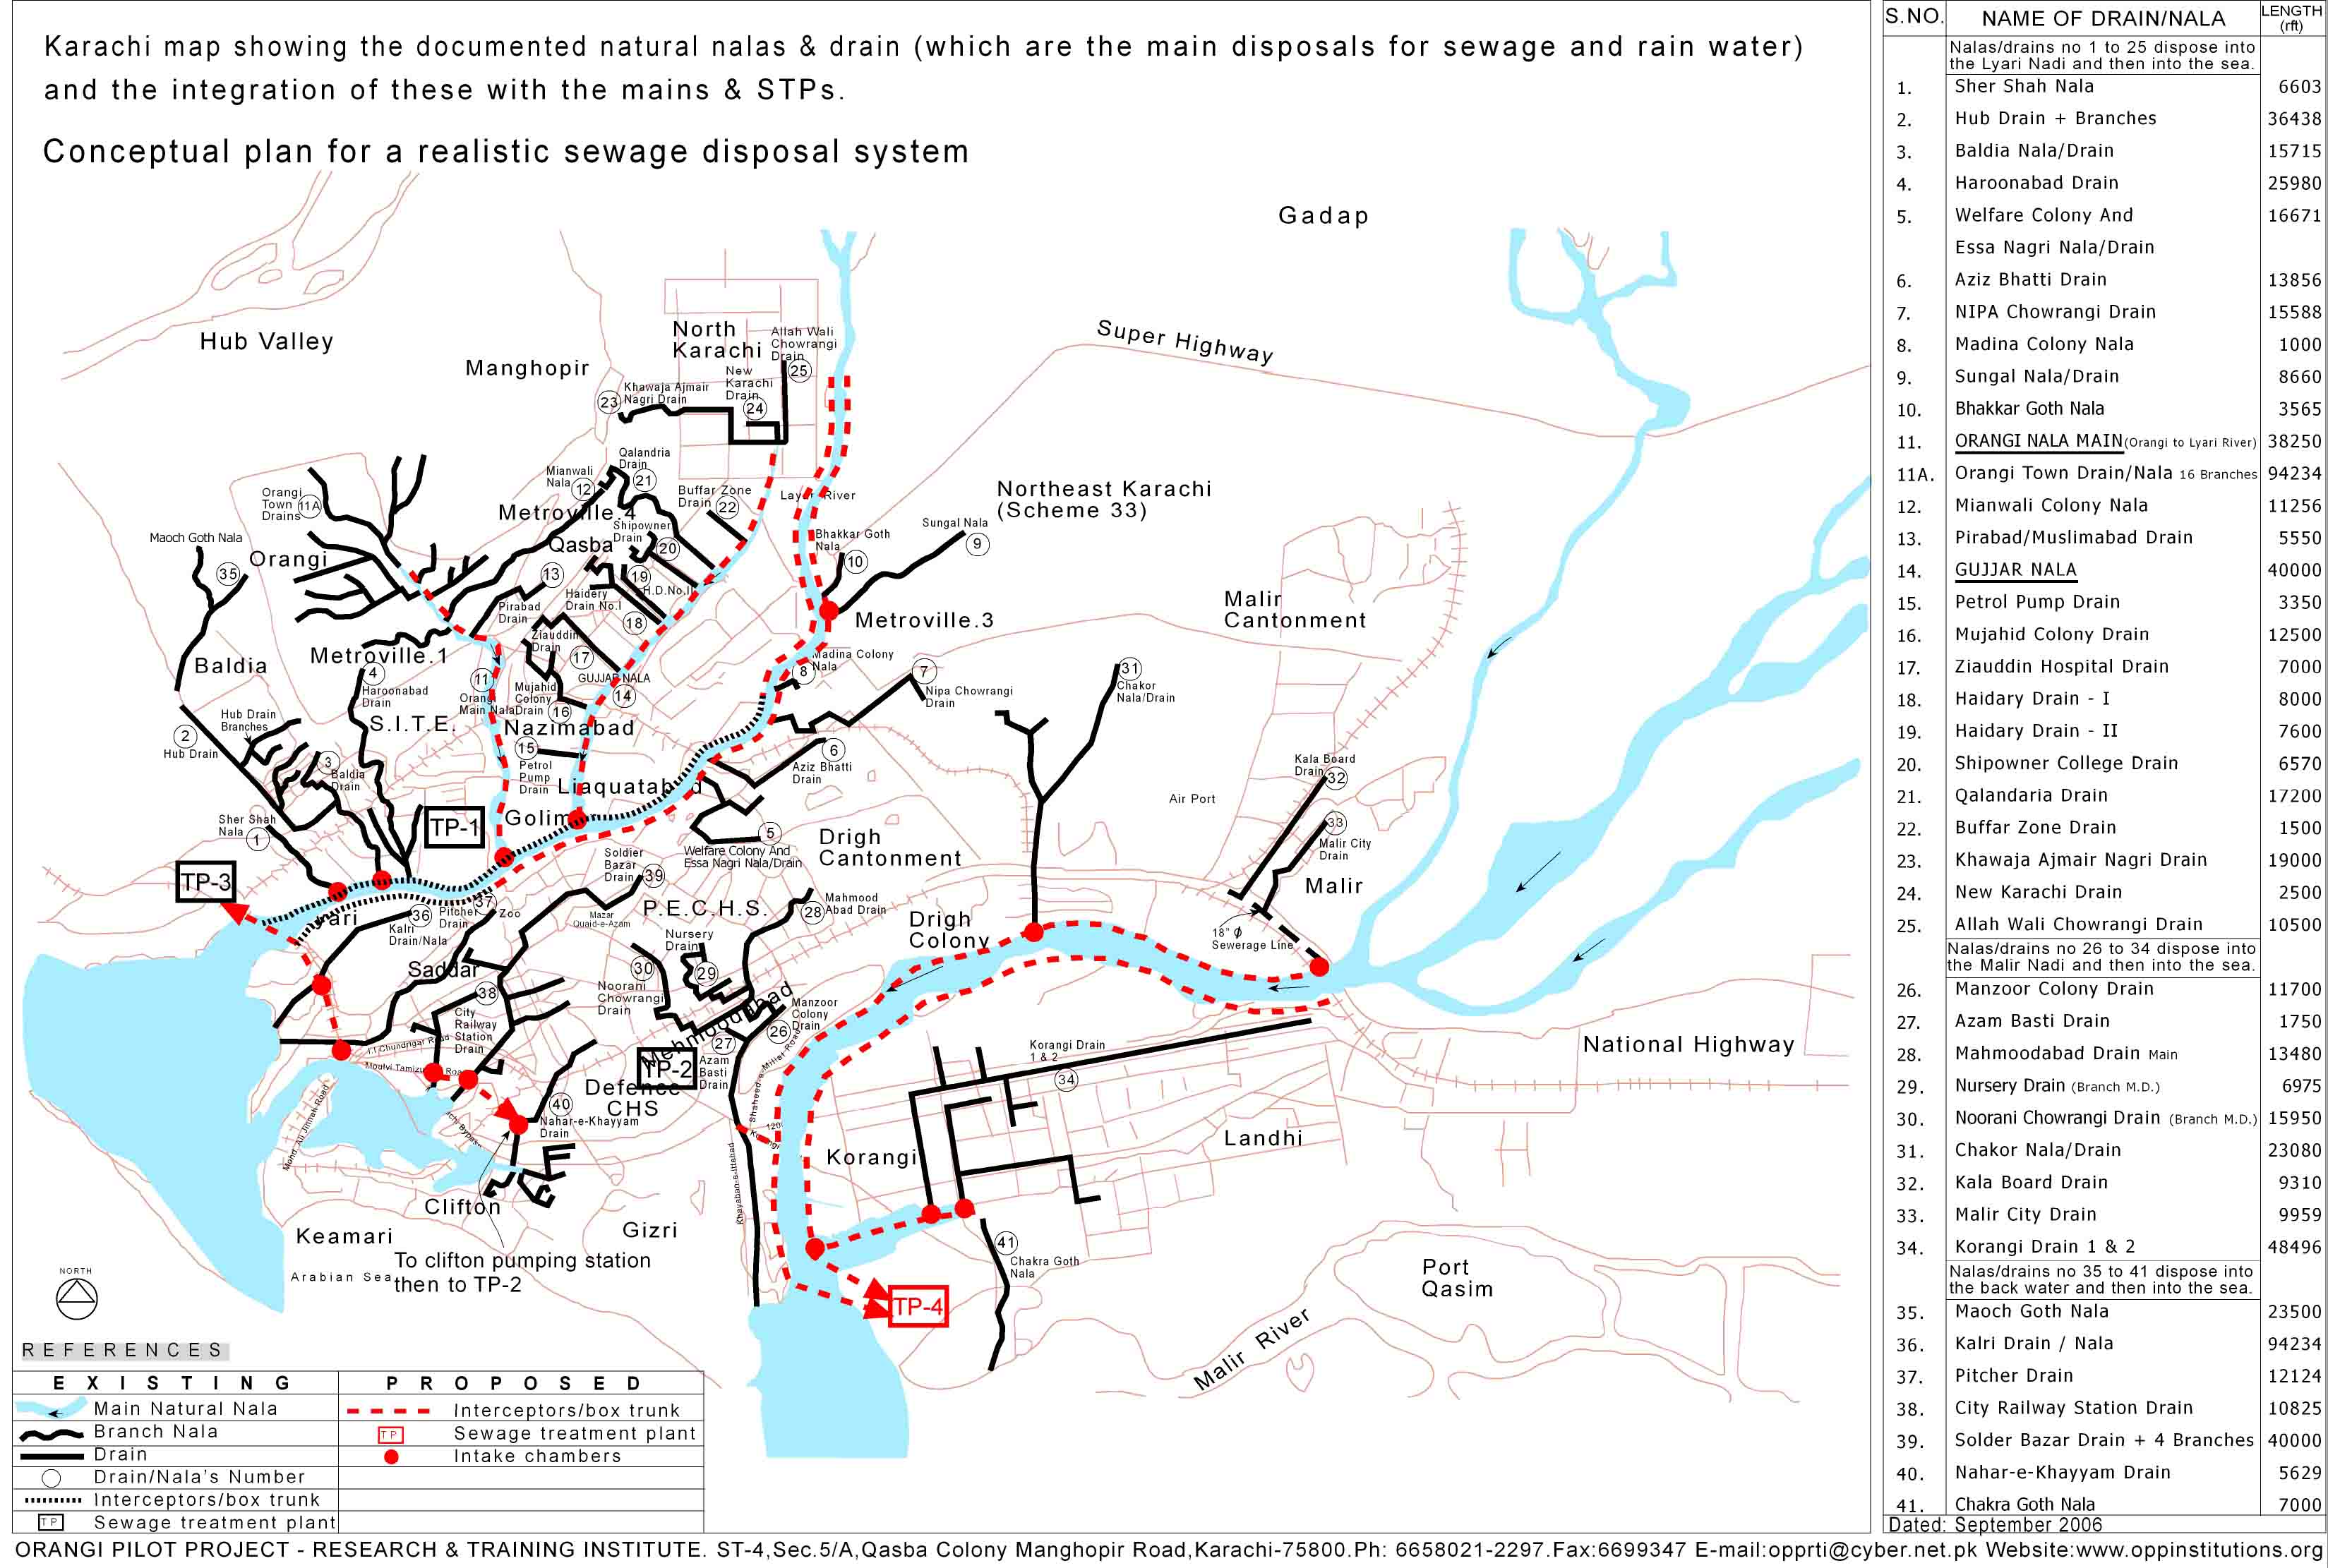
- Frequently collect local data about conditions of sewers and drainage lines through trained and verified volunteers for each of the 41 main sewerage lines in Karachi to prevent clogging and ensure a smooth flow for rainwater.
- An app design where people could register and complain about administrative problems such as garbage disposal, overflow of gutter lines, or damaged buildings by uploading pictures of the affected areas.
- Those pictures will be sent to captcha devices for people to select the pictures with a certain problem, thus teaching AI to identify and verify those pictures itself.
- This is a practical solution since it is already being used in mobile applications such as Pile Up.
- People will be able to mark themselves safe on the app.
- After marking themselves safe, they will be asked to permit to share their location.
- Depending on how many people mark themselves safe, the map will display their coordinates and provide an estimate of the risk factor.
- Data from government sources such as the National Database and Registration Authority (NADRA) will help gather information about people’s residences and workplaces.
- Using our social media network, we will form a volunteer task force that will be composed of students willing to give back to society in exchange for certificate/credit hours.
- Data from the volunteers will be sent to the Karachi Water and Sewerage Board (KWSB) to help solve the problems reported.
- Local mobile networking companies will ensure the safety of their respective customers by asking them to send a message to mark themselves safe or report an emergency and help improve the live data integration on the map about safe and risky zones.
- Local ambulance services such as Edhi and Chiipa will be tracked and updated on maps to categorize areas with and without medical facilities.
- The factors mapped will be assigned weights according to their contribution to worsening the flood situation.
- Factors will be assigned a positive weight if it worsens the situation like rainfall intensity, population density, bad infrastructure, etc, and a negative weight if they help improve the situation like availability of medical facilities and people marking themselves safe.
- Using an advanced algorithm, the overall risk factor will be calculated using these sub-factors and mapped as a layer onto the same map for people to identify high and low-risk areas.
- These measures will help reduce the loss of human lives and the adverse effects of floods on the economy caused otherwise due to inefficiency and lack of awareness.
- These methods use global data as well as local data and crowd-sourcing techniques to validate global data and to ensure people’s safety, including people who don't have much access to technology such as by assigning volunteers to be representatives of their areas and using data from NADRA and local mobile networks.
How We Developed This Project
- Natural disasters globally harvest the lives of millions of people annually and cause immense economic loss. Most of the losses are caused by avoidable consequences of these hazards and disasters. This has inspired us to create a tool not only for authorities but also for the general public about what roles and responsibilities they have as responsible citizens and also aid governments to take timely and appropriate measures to reduce the undesirable effects. Karachi in particular was the focus of this case study due to the recent unprecedented incident of heavy rainfall in August 2020 which caused the death of hundreds of citizens and severe damage to the city’s infrastructure and great loss to businesses.
- Our team consists of people from 5 different countries and had different perspectives over such incidents and came up with creative ideas as part of our challenge. We took inspiration from the COVID-19 map apps which helped us in our research. Having team members of different expertise, we decided to develop an application/website based on maps that was accessible and self-explanatory to the general public. We also used ideas that did not require intense knowledge and the use of technology to also address the problems faced by the general public in case of a natural disaster.
- We decided to make the most use out of the resources provided by NASA and the other space organizations, therefore we combined the data from different maps and combined them with the local resources to end up with a risk map. The back-end was implemented using Flask. Similarly, the front-end was built using Node.js and the Leaflet library for JavaScript. The main problem we faced was the resolution of the images not being on the same level and some of the maps being too general for our purposes. We had to use photoshop to enhance and edit the maps accordingly.
How We Used Space Agency Data in This Project
- Since we worked on a map interface, we used data primarily from NASA and its partner agencies.
- We first studied the resources available under the resources tab in our task (Planet, with people).
- Here we made extensive use of SEDAC and JAXA maps and integrated them into our interface.
- We chose certain local factors based on articles, newspapers, local news channels, surveys, experiences, past incidents etc.
- After studying these factors we researched the remote sensing data corresponding to those said factors.
- Some examples include vital data such as population density, age demographics, elevation, surface run-off, rainfall intensity, etc. since these factors concerned the hazard of water accumulation in Karachi.
- Then, we researched on the resources available in other challenges particularly the challenges “A Flood of Ideas” and “Automated Detection of Hazards” since these challenges were close to our task.
- The resources we found under these tabs include JAXA Global Rainfall Watch, NASA Worldview, and Global Flood Monitoring System.
Project Demo
- Note: In the long run we hope to integrate the data visualization and mapping tool (available on our github) with the Wix interface (https://adilshaikh25.wixsite.com/weshowedapp).
- Note: We made our own domain using the GoDaddy offer given to us but couldn't upload our back-end since the data we had was not static.
- Note: We also look forward to make a mobile app soon.
https://drive.google.com/file/d/1JoxJUUQG1L_nbiem531Nxn2fBGnoRNRk/view?usp=sharing
Data & Resources
Population density and age demographics; https://sedac.ciesin.columbia.edu/data/collection/gpw-v4
Accumulative and real-time rainfall intensity; https://sharaku.eorc.jaxa.jp/GSMaP/
Global Man-made Impervious Surface (GMIS) Dataset From Landsat;
https://sedac.ciesin.columbia.edu/data/set/ulandsat-gmis-v1/maps
Global Human Built-up And Settlement Extent (HBASE); https://sedac.ciesin.columbia.edu/data/set/ulandsat-hbase-v1
Global Mangrove Forests Distribution; http://www.ciesin.org/documents/mangroves-final_000.pdf
Urban Extents Grid; https://sedac.ciesin.columbia.edu/data/set/grump-v1-urban-extents
Flood Mortality/Risk Rates: https://sedac.ciesin.columbia.edu/data/set/ndh-flood-mortality-risks-distribution
https://sedac.ciesin.columbia.edu/data/set/ndh-flood-mortality-risks-distribution
Research links for problems of Karachi;
https://www.thenews.com.pk/print/279951-problems-and-solution-for-karachi
https://www.thenews.com.pk/print/700793-what-is-solution-to-karachi-issue
https://dailytimes.com.pk/291899/six-major-issues-of-karachi/
http://www.pbs.gov.pk/population-tables
https://earthobservatory.nasa.gov/images/147330/extreme-monsoon-rains-in-pakistan
https://www.euronews.com/living/2020/09/07/why-is-karachi-drowning-and-could-we-have-prevented-it-
https://www.mercurynews.com/2020/08/28/at-least-63-die-in-monsoon-flooding-in-pakistan/
Crowdsourcing;
https://en.unesco.org/news/using-crowdsourced-data-help-communities-prevent-disasters
https://www.mainstreethost.com/blog/four-examples-of-clever-crowdsourcing-campaigns/
Drainage Map of Karachi;
https://www.worldmap1.com/map/pakistan/karachi/karachi%20road%20map.jpg
Human Planet Initiative; https://www.itc.nl/hpi-forum/human-planet-initiative/
https://ghsl.jrc.ec.europa.eu/documents.php
Karachi Elevation Data;
https://sealevel.info/MSL_graph.php?id=490-021
Picture Pile:
https://scistarter.org/picture-pile
Urban-Rural Population and Land Area Estimates; https://sedac.ciesin.columbia.edu/data/set/lecz-urban-rural-population-land-area-estimates-v2